Identifying slow cold starts
Ah, yes, the dreaded Lambda cold starts! So often the cause of many performance concerns, especially for user-facing API functions.
If you go to the Functions page and navigate to any of your function, you can see information about that function’s cold starts in the Metrics tab.

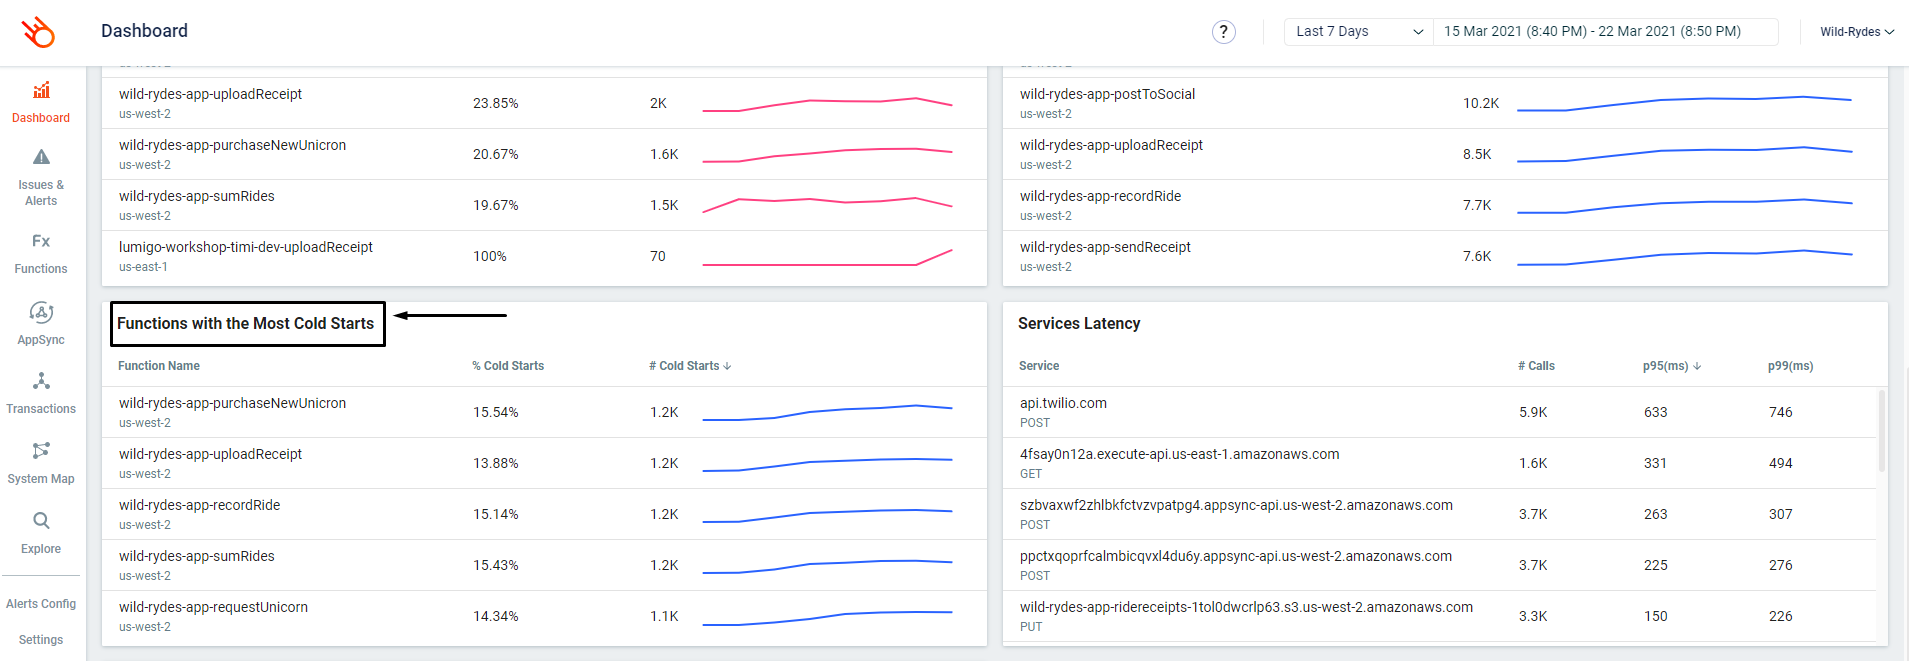
When you have lots of functions, it’s not feasible to go through each function individually. In the Dashboard you can use the Functions with most Cold Starts widget to quickly identify problematic functions.
User-facing functions, such as those behind API Gateway, are often latency sensitive. In some cases, you may wish to use Provisioned Concurrency to eliminate cold starts altogether. For instance, when you have really strict latency requirements, or if you’re using JVM/.Net Core runtimes and cannot optimize your code any further to keep cold start duration under an acceptable latency range.
In some really unfortunate cases, cold starts can also stack up when one API function calls another (via API Gateway) and can cause further delays. You can easily spot these cases in the Transactions page, by looking at the Cold Starts column.

If this happens frequently, then it might also be a good reason to use Provisioned Concurrency. Maybe one cold start of a few hundred milliseconds is acceptable, but when a few of them stack up on a single transaction, that can result in noticeable delays to users.
Finally, you can also use the lumigo-cli, our open source CLI tool, and run the analyze-lambda-cold-starts command to analyze the cold start performance for all your functions in an AWS account.
