Debugging performance issues
- Go to the Dashboard page, and have a look at the
Service Latencywidget at the bottom right. This shows you the tail latency for services that you are calling from your Lambda functions.
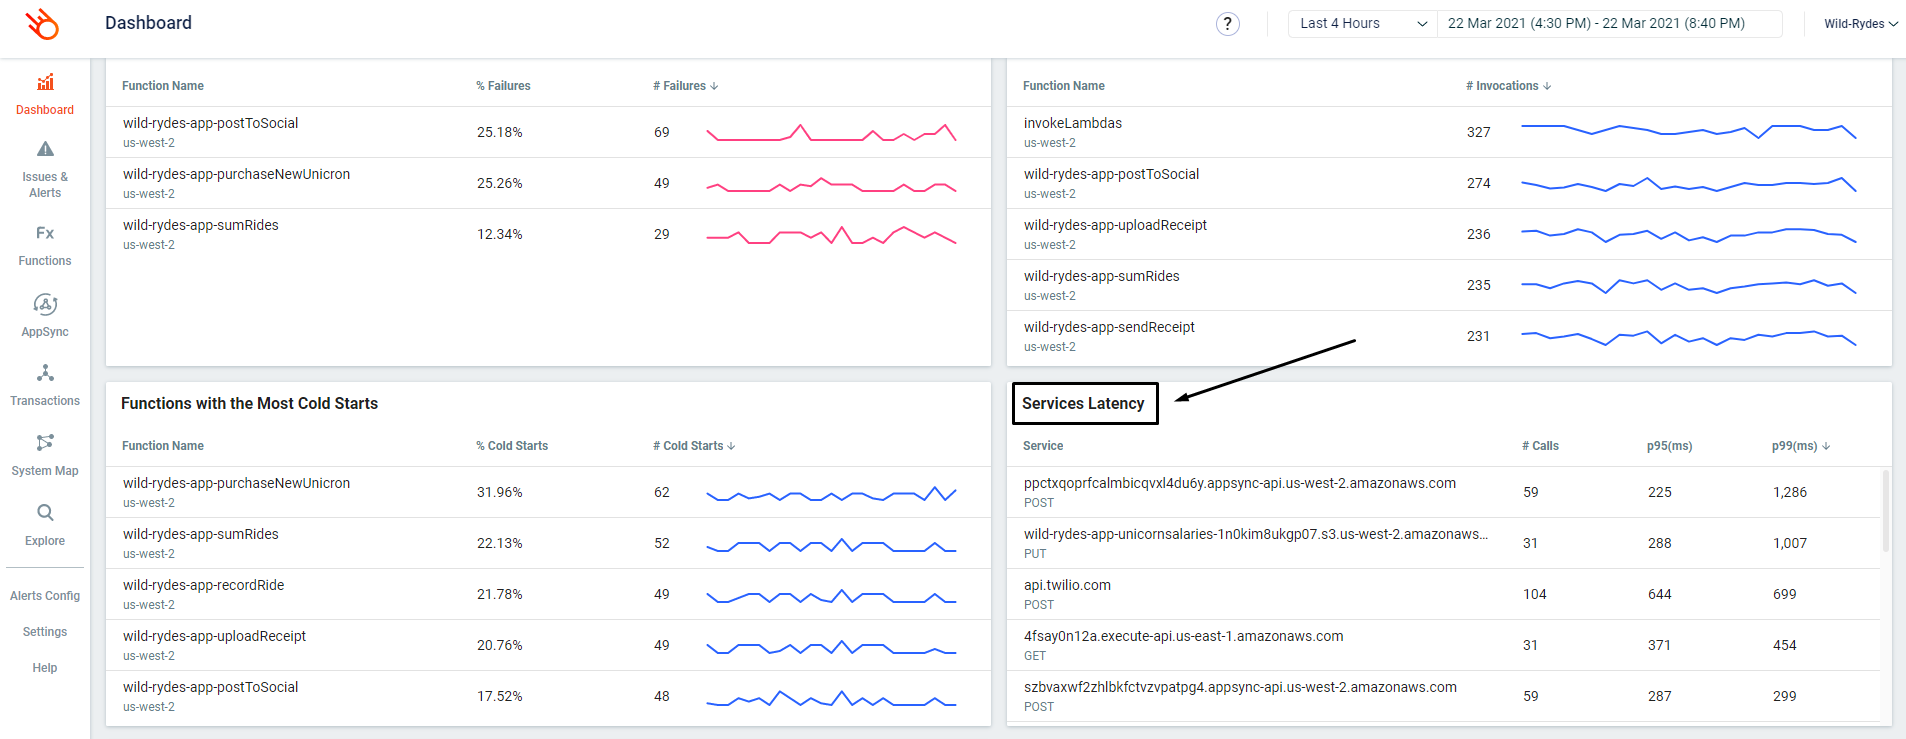
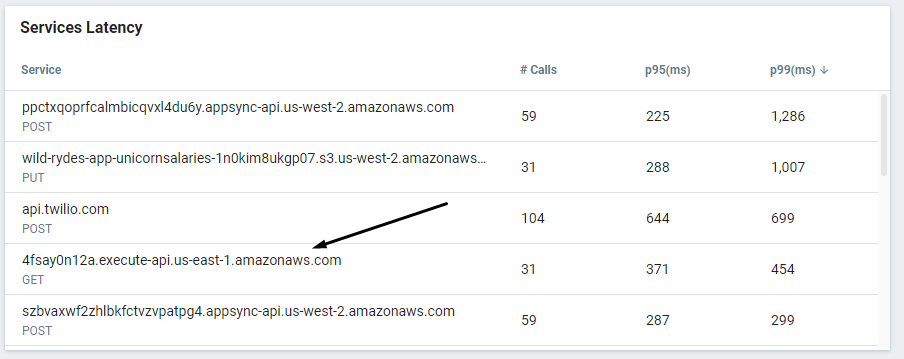
- By default, this widget is sorted by the p95 (ms) column. Somewhere amongst the top, you might see similar to
4fsay0n12a.execute-api.us-east-1.amazonaws.comup there, by either p95 (ms) or p99 (ms).
- Click on the p99 latency value (454 in my case)
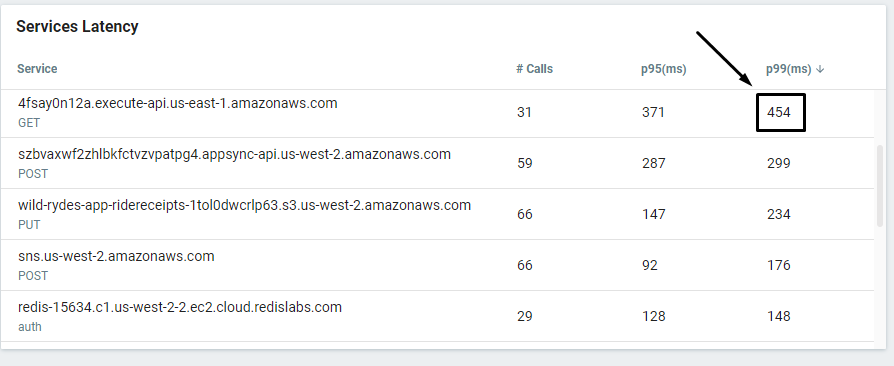
This takes you to the Explore page with a prefilled query that finds the transactions where this service was involved and recorded a latency that’s equal to or greater than the latency value you clicked on.

- Click on one of these transaction to see what happened.

In this transaction, you can see that we made 3 calls to 4fsay0n12a.execute-api.us-east-1.amazonaws.com.
- Click on the Timeline tab and you will see that one of the requests to
4fsay0n12a.execute-api.us-east-1.amazonaws.comtook 4345ms.
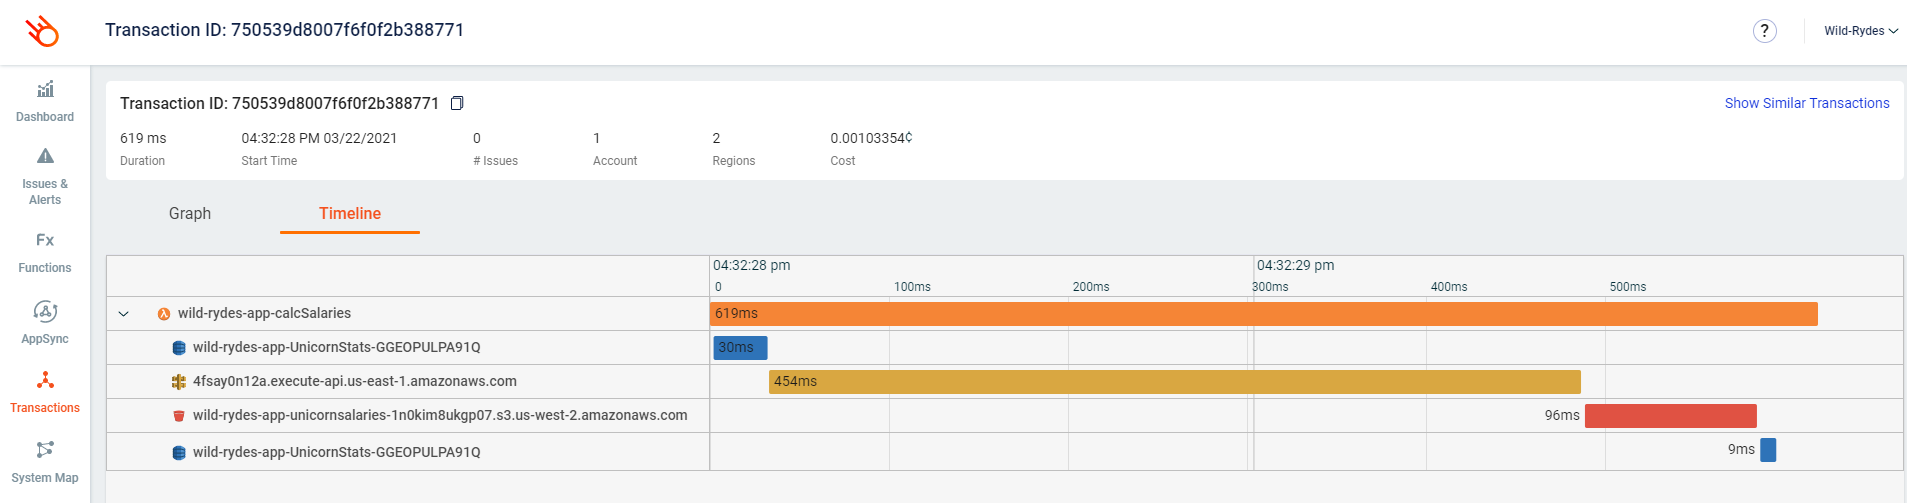
- Click on the slow HTTP request, and see that the response was for
Bucephalus.

- Go back to the Explore page and find other transactions where
4fsay0n12a.execute-api.us-east-1.amazonaws.comhad been slow. See if you can spot any commonalities to these slow requests.