Part 2: Serverless Observability
In this module, you will integrate Lumigo with the demo application.
Viewing your application in Lumigo
Lumigo will trace the invocations of your application. The first thing we will use it for is to get an understanding of how our application looks in real life.
- Click on the System map to have an overview of your application’s architecture:
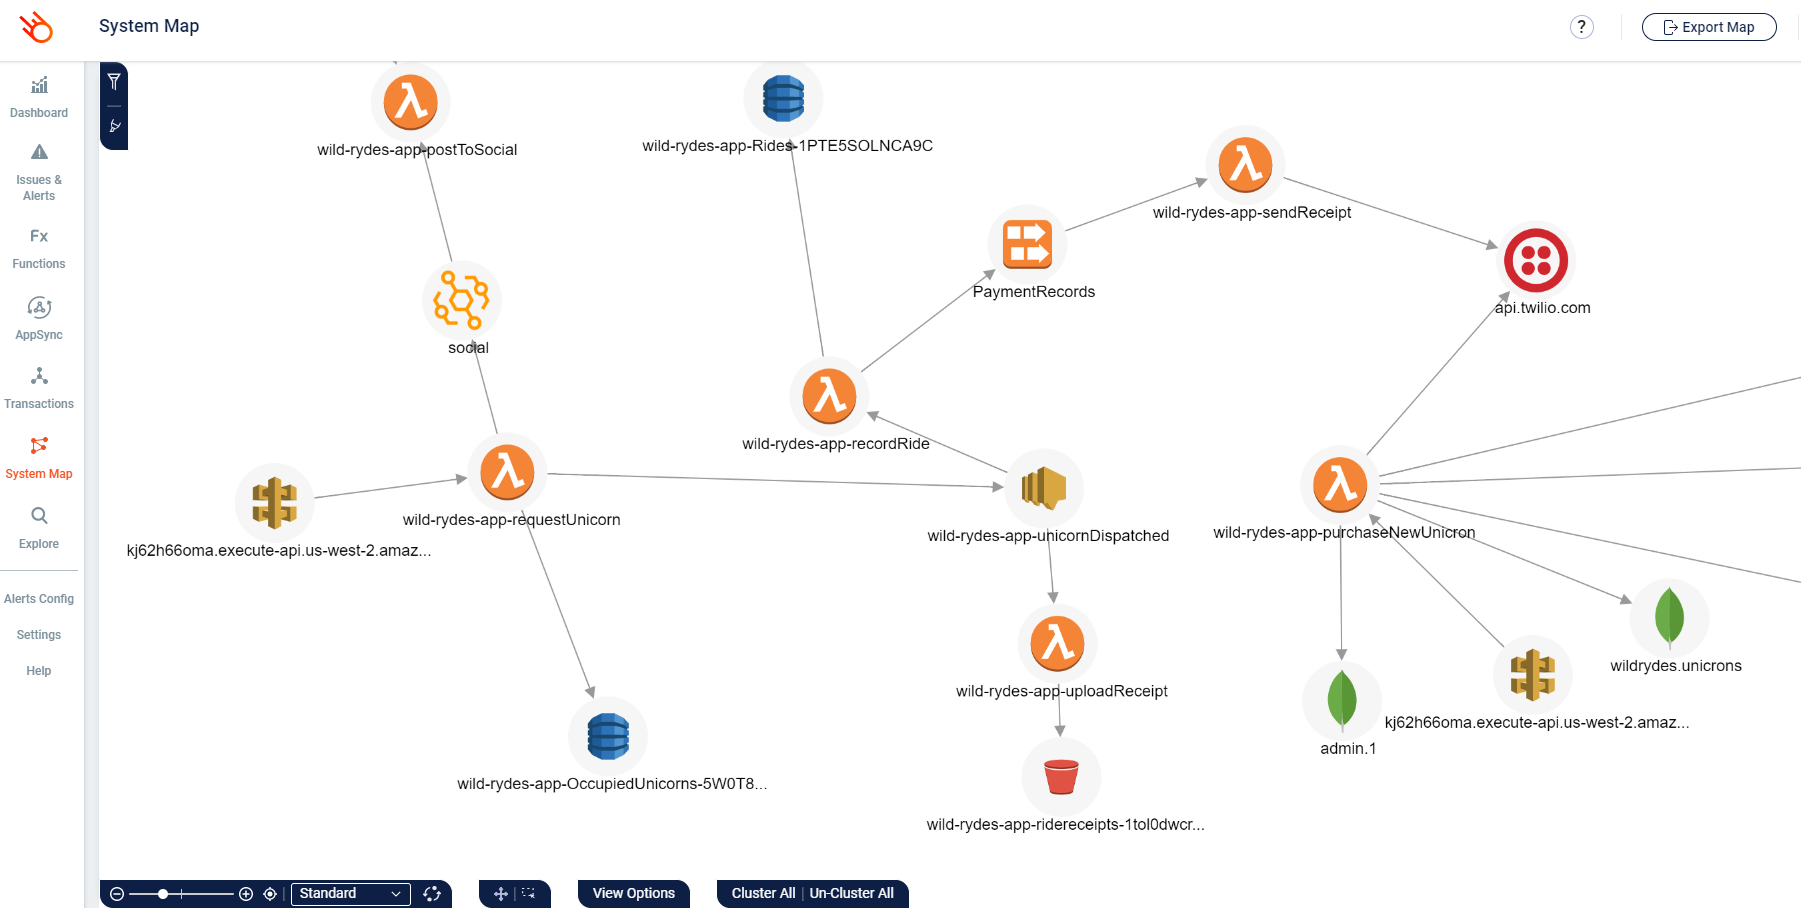
Notice how this is identical to the architecture diagram we drew by hand, except it’s drawn from the actual invocations that Lumigo has traced, so it’s always up-to-date and based on actual data.
- Explore the different functions’ stats and invocations in your account using the Functions page:

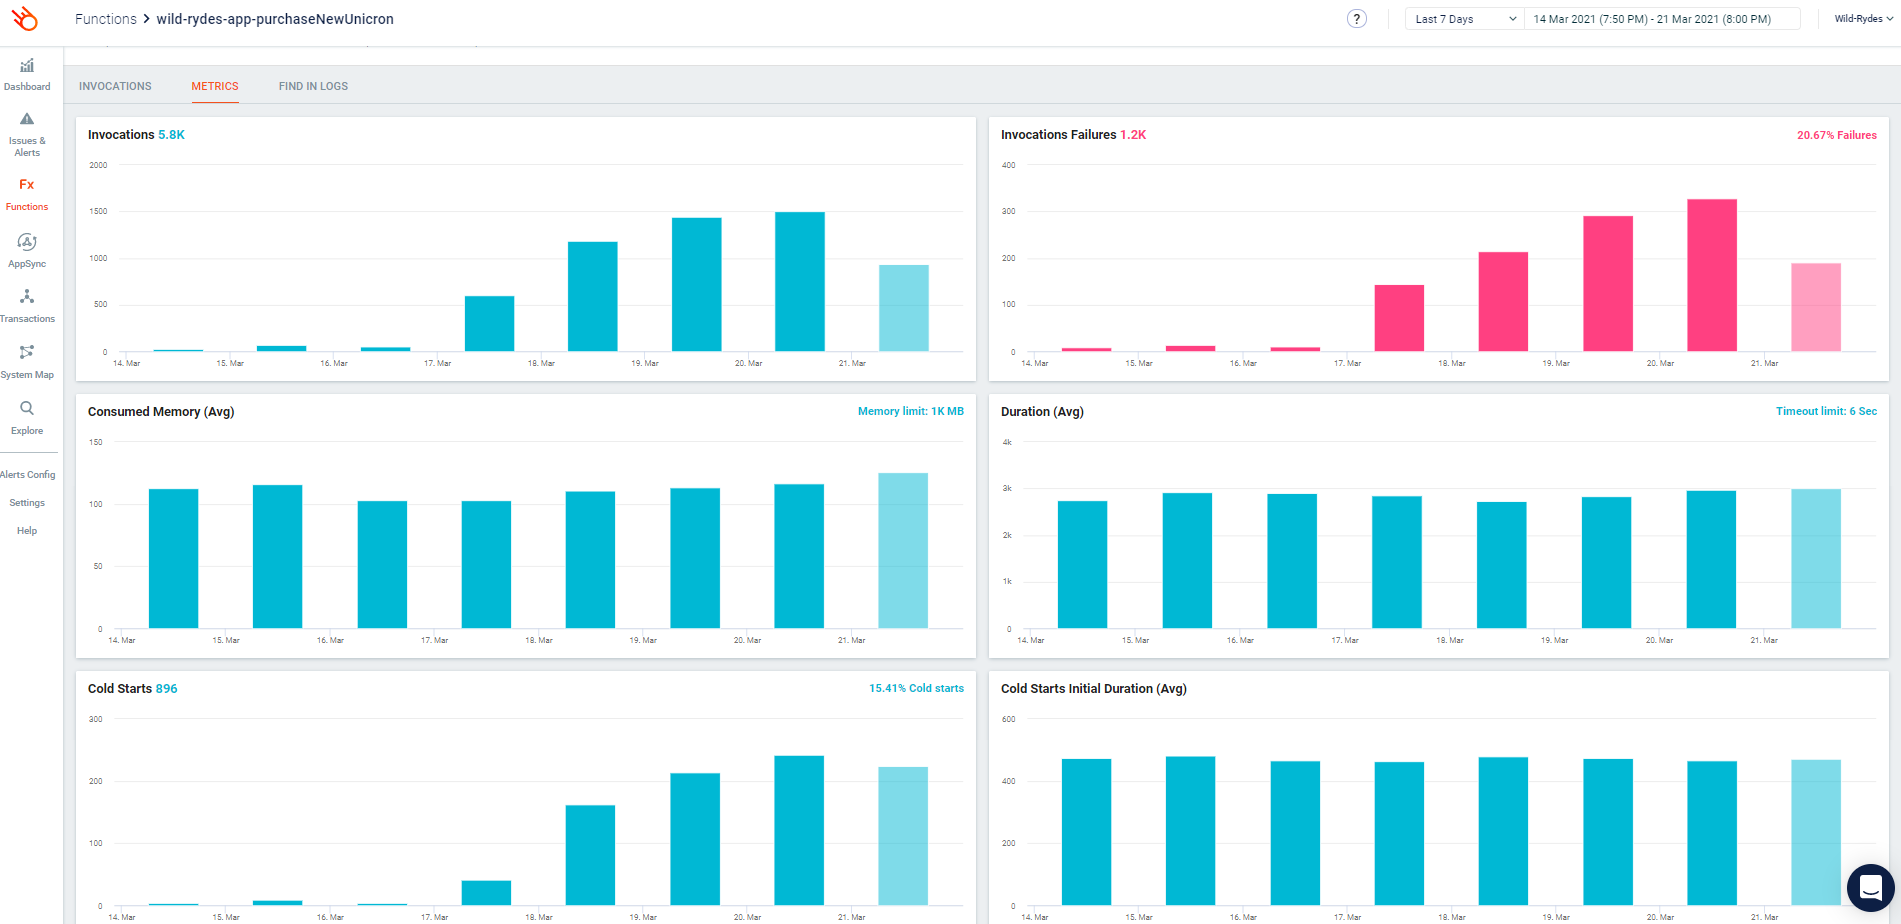
- Click into any of the functions to get more details on it:

Clicking on the Metrics tab would show you some additional metrics like the number of cold starts as well as cold start durations.
- Also, don’t forget to check out the Transactions page to see the recent transactions that Lumigo has traced:
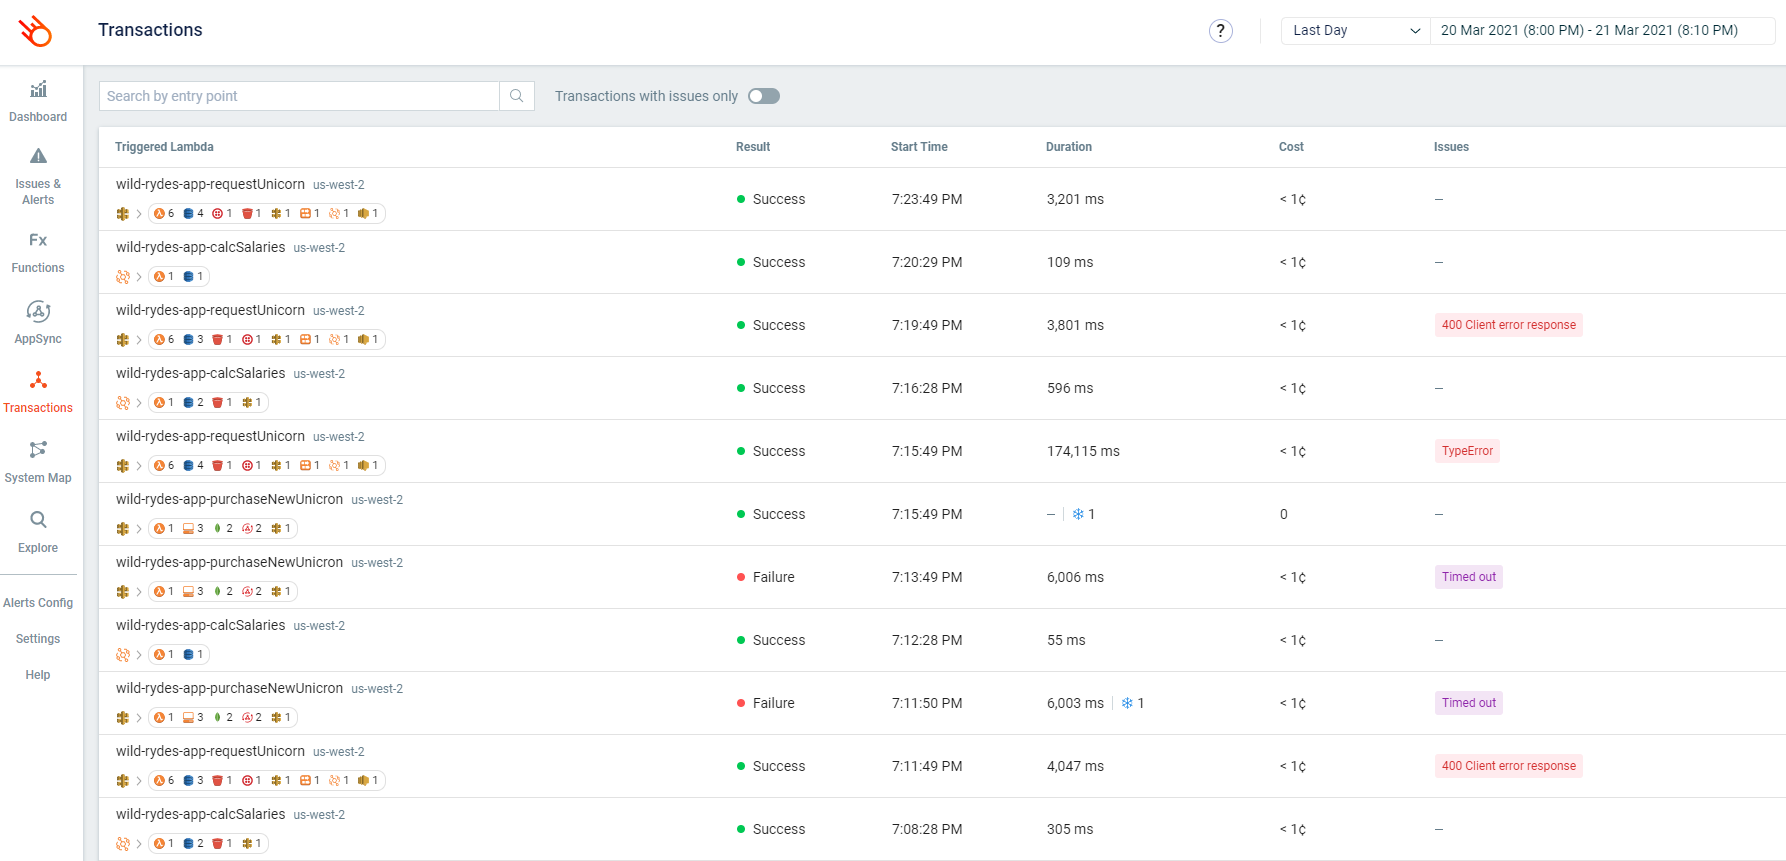
- In this page, if you click on one of the transactions then you can see what happened on that transaction alongside the logs for all the participating functions. Click on one of the transactions that started with the
requestUnicornfunction and you should see something like this:
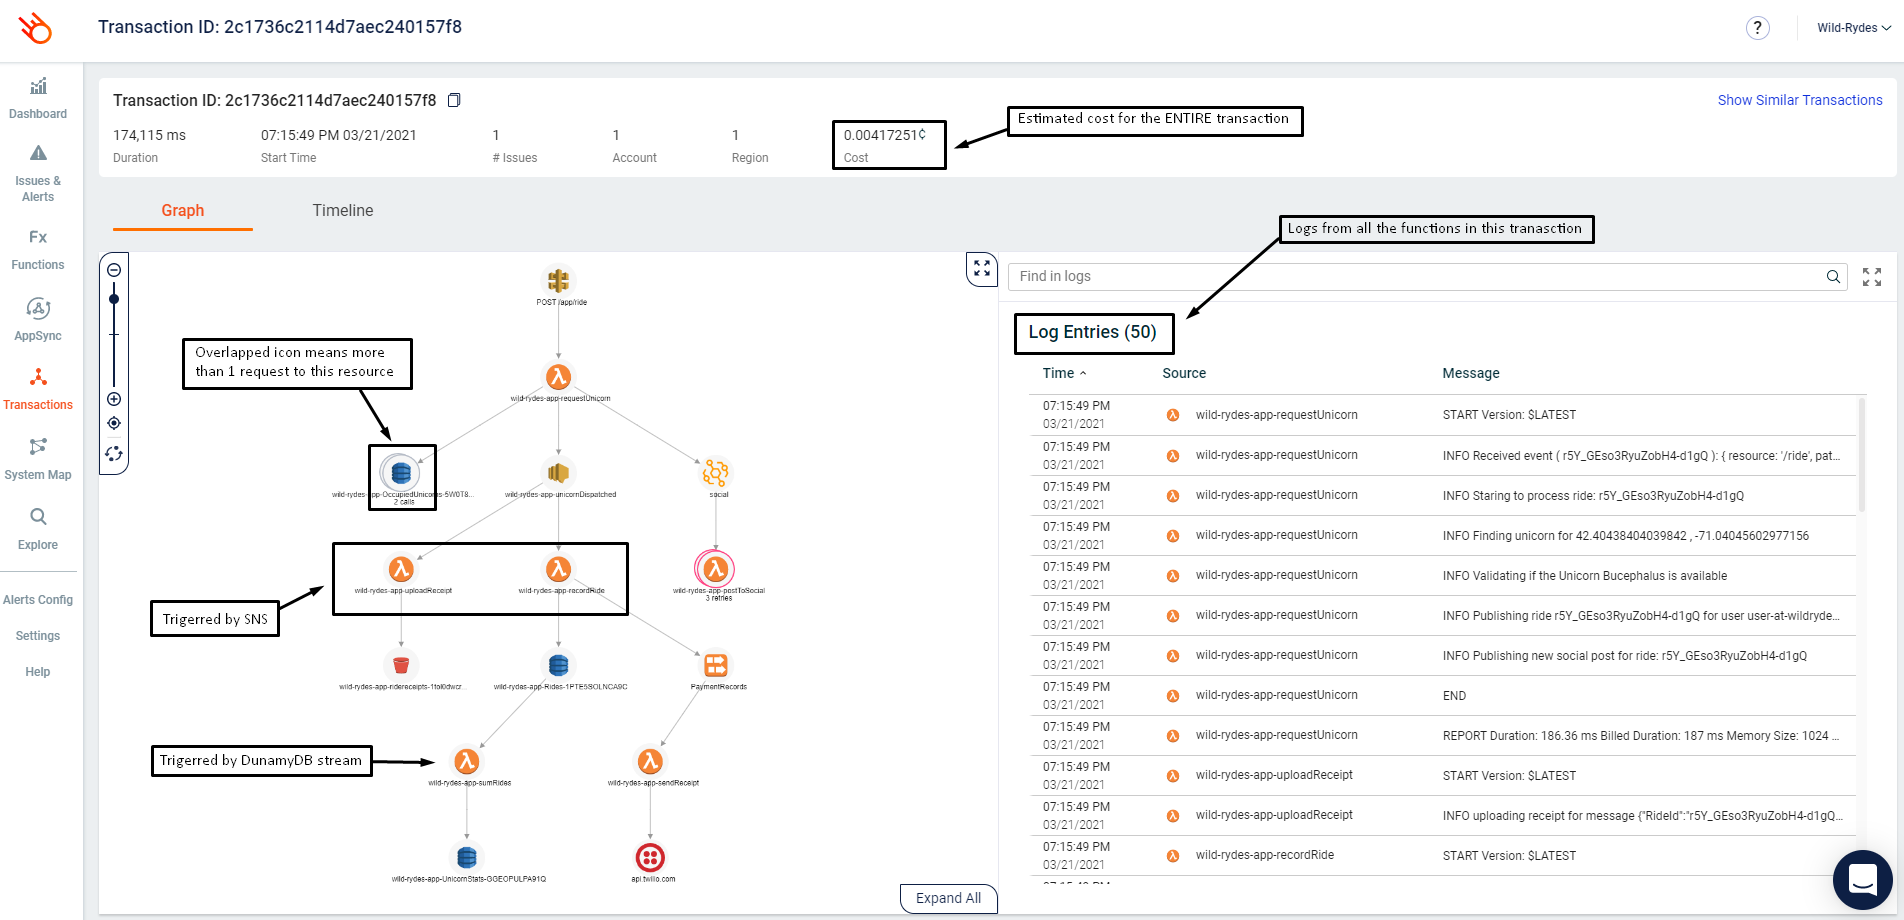
- If you click on any of the icons in the graph, you can see even more information about that resource, including any request and response to and fro the resource. For example, if you click on the
requestUnicornfunction, you should see its return value, invocation event, environment variables and its logs:

Similarly, if you click on the unicornDispatched SNS topic, you will see the sns.Publish request that requestUnicorn function made to it. Notice that sensitive data like API keys and auth tokens are scrubbed and were never sent to Lumigo’s backend in the first place.

Where a resource was accessed multiple times during a transaction, you can also iterate through all the individual requests too. For example, the requestUnicorn function did a dynamodb.Get and then dynamodb.Put against the OccupiedUnicorns table:

Having all these information at your fingertips makes it easy for you to understand what actually happened during this transaction without spraying your code with manual instrumentation code!
- One final thing, click on
Timelineshows you where the time was spent on this transaction to help you identify culprits when performance issues arise.

Now that you know your way around Lumigo, let’s use it to troubleshoot the issues we are seeing in the demo app.